Debugging PHP in editor
I would like to describe how to set up xDebug to work in your phpStorm IDE. There are different options available depending on your preference - you can have xDebug always try to initiate a connection for your devbox, or you can use browser plugins and extensions to choose when xDebug should try to run.
Requirements
- sudo access to virtual host config files
Automatic connection
This method means that you don’t need any browser extensions, cookies or bookmarklets, but may cause small performance issues because xDebug will try and initiate a connection to your computer on port 9000 every time you load a page on your dev. However, I have not noticed any degradation in performance, and it’s unlikely to be a problem since devbox is usually on your own computer. If you often connect outside of your own devbox though it might not be the best option - but I have not tried it, so equally it may be fine. In order to get this to work, you have to edit your virtualhost configs on devbox. You can find the list of files you need to edit somewhere in
cd /etc/apache2/conf/vhosts/
but the exact location depends on how you set up your virtual hosts, what operating system you use and so on. You need to add the following code to all your Virtual Host declarations where you wish to debug:
	php_value xdebug.remote_autostart 1
	php_value xdebug.idekey xdebug-stefan
Note that there may be several Virtual Host blocks in each .conf file, so make sure you get them all. Your IDE Key can
be anything, but it must be unique if more developers are connecting to same dev machine (for example staging machine).
In my case I used IDE key xdebug-stefan . Once you are done editing your .conf files, you can use
httpd configtest
the above command will check the conf files and points out all syntax error in them. It’s good practice to test
configuration before restarting server. Then assuming it says Syntax OK at the bottom run this:
sudo httpd reload
to reload the apache config or
sudo httpd restart
to restart the apache server using saved config
Connection via browser plugin
You can also start xdebug with a GET parameter, a POST parameter or a COOKIE. The name of the parameter for GET and POST
must be XDEBUG_SESSION_START, and the value should be your chosen IDE key. You can also use a cookie to track the
debug session - details are here: http://xdebug.org/docs/remote#browser_session. The easiest way to achieve these are through browser extensions, which can handle these items
for you. For Firefox, I used “Easy XDebug (with move-able icon)”. It allows you to set the IDE key within its settings,
and adds an icon to the status bar (which you can move) to turn debugging on or off. This can be used when you don’t want
xdebug to attempt an automatic connection to the IDE. There are also bookmarklets you can use to initiate sessions -
google is your friend!
IDE Setup
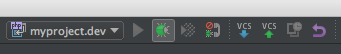
Find the debug toolbar. It has a dropdown list, a play button, a debug button, telephone handle and some other things.
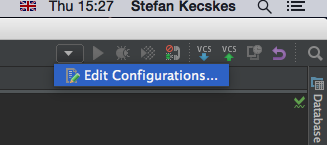
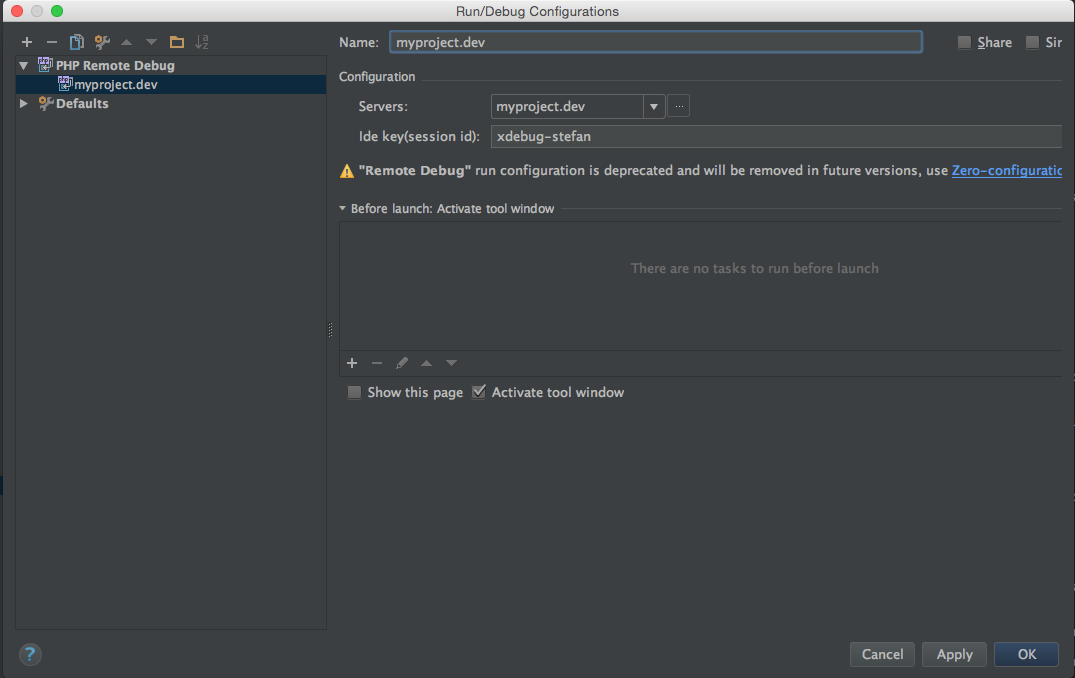
Click the configurations dropdown list, and then click ‘Edit Configurations…’
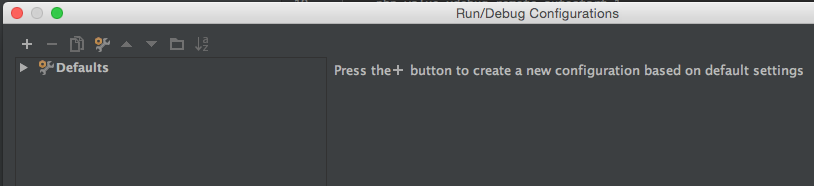
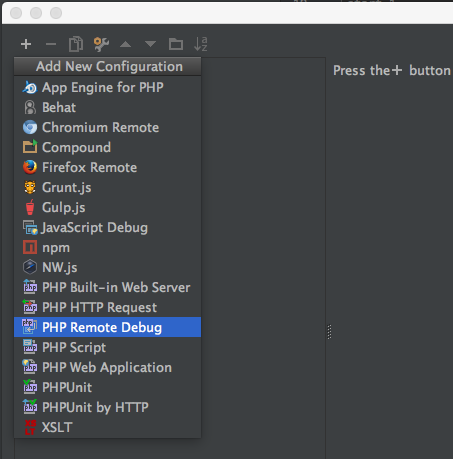
In the window that appears, click the green + in the top left, then ‘PHP Remote Debug’. You’ll get a new configuration appear in the list on the left.
Click the ‘…’ button next to the server dropdown. A new window pops up.
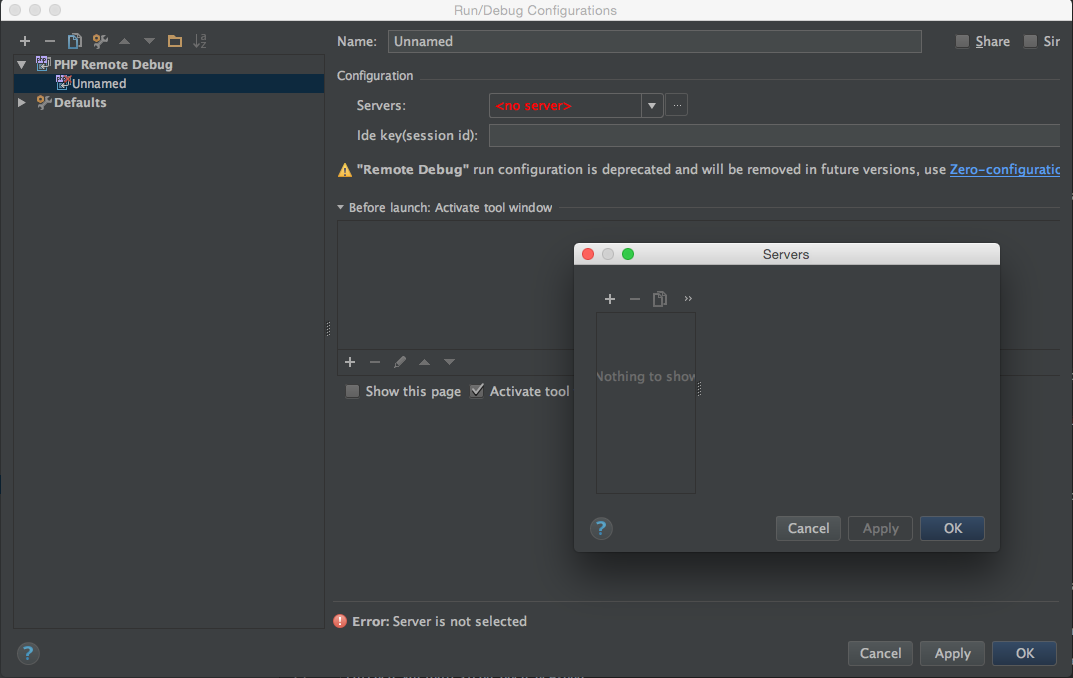
Add a server details as shown in the image, where host should be your virtual host name
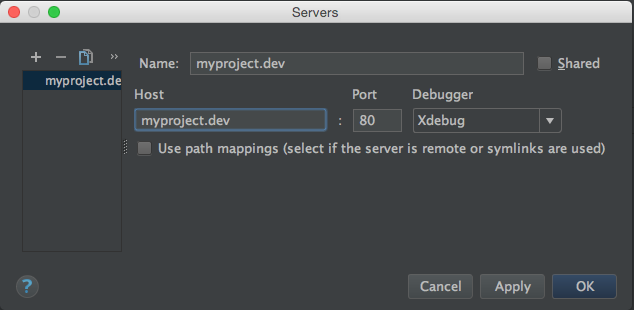
Press OK, and the server should be selected. Enter the IDE Key that you have set up in your Virtual Host config or browser extension, and press OK.
Usage
Select your debug configuration from the dropdown in the toolbar, then press the debug button.
The debug window will open.
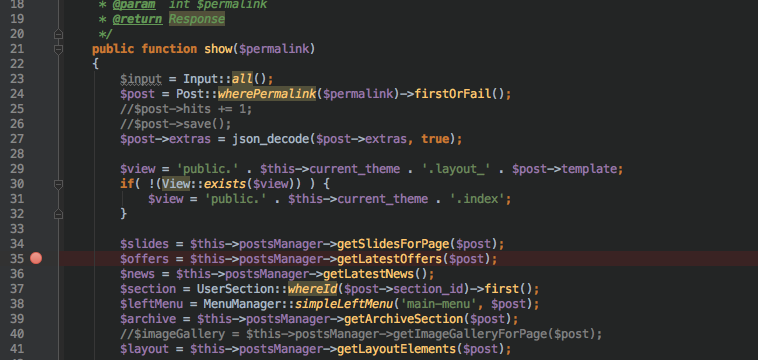
Set a breakpoint on the line of code that you want execution to stop at. You can only set breakpoints on certain lines - not on blank lines or comments for example.
If you are using a browser extension, you need to enable it now (may work differently depending on what you are using) and reload the page. If using automatic connection, just reload the page.
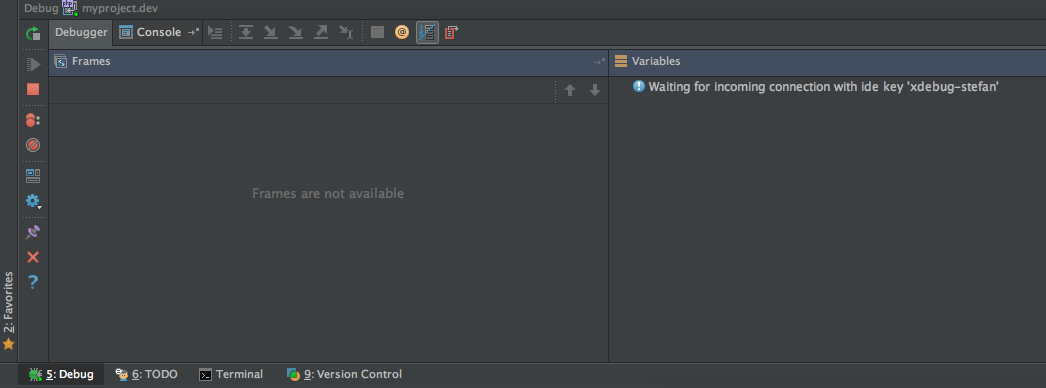
Your PhpStorm debug window is now filled with the state of the application at your breakpoint:
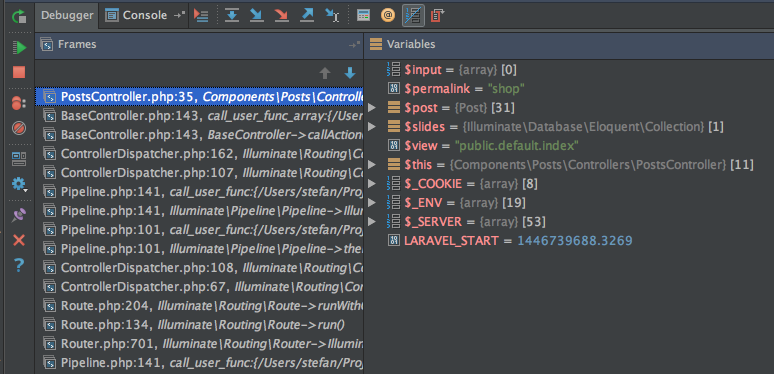
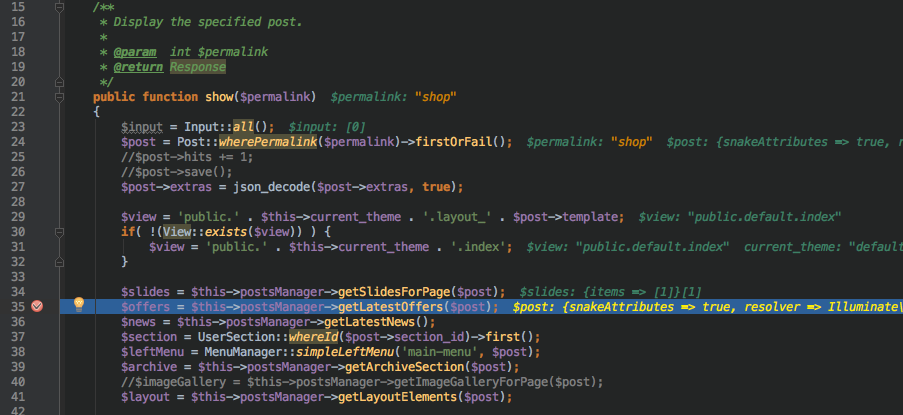
When xDebug stops the program it will display temporary values of variables as seen on image.
The left-hand side of the debugger shows the ‘frames’ - this is effectively a stacktrace, with a new frame created for each function call within the application. You can click on the different frames to see the state of the variables when each method was called.
The middle section shows the current variables. Objects, arrays and primitives are all shown with different icons, and you can expand objects and arrays to look inside them.
The right-hand side shows ‘watches’. You can set up a watch for any variable in the system, including a variable deep within a nested array or object, for quick reference. You can also evaluate an expression here (such as adding a watch for ‘$total > 10.00’ or something) which is pretty handy. I’m not using that and that tab is turned off on image.
Hovering over any of the buttons in the window will show you its purpose. The main toolbar functions are the step into, step over and step out buttons. Step Into will step into the function at the current execution point, so you
can debug that. Step over will just run the function and move to the next line in the calling function, so you can just
see its output without debugging it. Step out will run the rest of the current function and step back out into whatever
called it. There is a button to run up to your cursor as well, but this only works if your cursor is on a valid
breakpoint location - eg, not blank lines, comments etc. Finally, the button on the far left (Show Execution Point) will
show you where in the code the current execution point is.
Top tip: you can right-click on a breakpoint and set a condition for it, so that it will only break when the condition is met. If you press the ‘More’ link, there is a whole window of other options such as logging messages to the console when the breakpoint is hit, only hitting the breakpoint if a different breakpoint has been hit already, removing the breakpoint once it has been hit etc. You can get to this breakpoint manager via a button on the left hand side of the debugger window as well.
Once you are done debugging, you can click the big red ‘stop’ button in the debugger to stop the script at that point, the Play button to continue running the script (to the end, or to the next breakpoint - whichever is sooner!). If you use ‘play’ to continue script execution, your debug session will not be ended, so you can reload again straight away to start debugging from the first breakpoint.
If you accidentally close the debug window, the debug session will not be ended, but you can bring it back up through the view menu, or Alt-5 if all else fails. Click the stop button to end the session. If the session is not ended, you’ll not be able to start a new debugging session (though the existing session should still show any new debug information when you reload).
Debugging secure
With https, the origin of the connection is hidden from the server, so xdebug tries to connect back to the proxy server
instead (.88), and the connection is refused. You can get around this by adding *.dev to your local addresses section
in the connection setup, so that connections to your dev skip the proxy server. Everything else then works as before.
UPDATE
Debug Port
Later this year, I upgraded my php to version 5.6. I was surprised that the above steps didn’t work as before and found out that I had to change ports, because php5.6 is defaultly not listening on port 9000 even when the xdebug is installed.
Thanks to Luca there is easy solution on how to fix that https://twitter.com/Stefan_Kecskes/status/634037691479408640 .