Did you know that the efficiency of your application hinges significantly on how you model your data?
Most backend software engineers, including myself for many years, don’t think much about data modeling. We understand the basics of SQL and ORM, know a few CRUD operations, and ensure that data is stored and retrieved correctly and that relationships between tables are maintained. Often, we leave the intricate details of data structures and performance to the DB Admin team, assuming that upscaling servers will solve everything. I used to think data modeling was just a fancy term for database design with only one right way to do it. However, as businesses grew and I collaborated with data scientists and analysts, I realized they were often dissatisfied with data structure and performance. Running their queries on the production database slowed down services and took ages to return results. That’s when I learned about the crucial differences between transactional and analytical data modeling, each with its own tools and techniques.
In this blog post, I will delve into these differences, discuss their unique tools and techniques, and share my personal experiences and insights from over a decade in the field.
Transactional Data Modeling
Transactional data modeling involves designing a database schema to support daily operations and transactions in a business. This approach focuses on normalizing data to reduce redundancy and improve data integrity.
Normalization
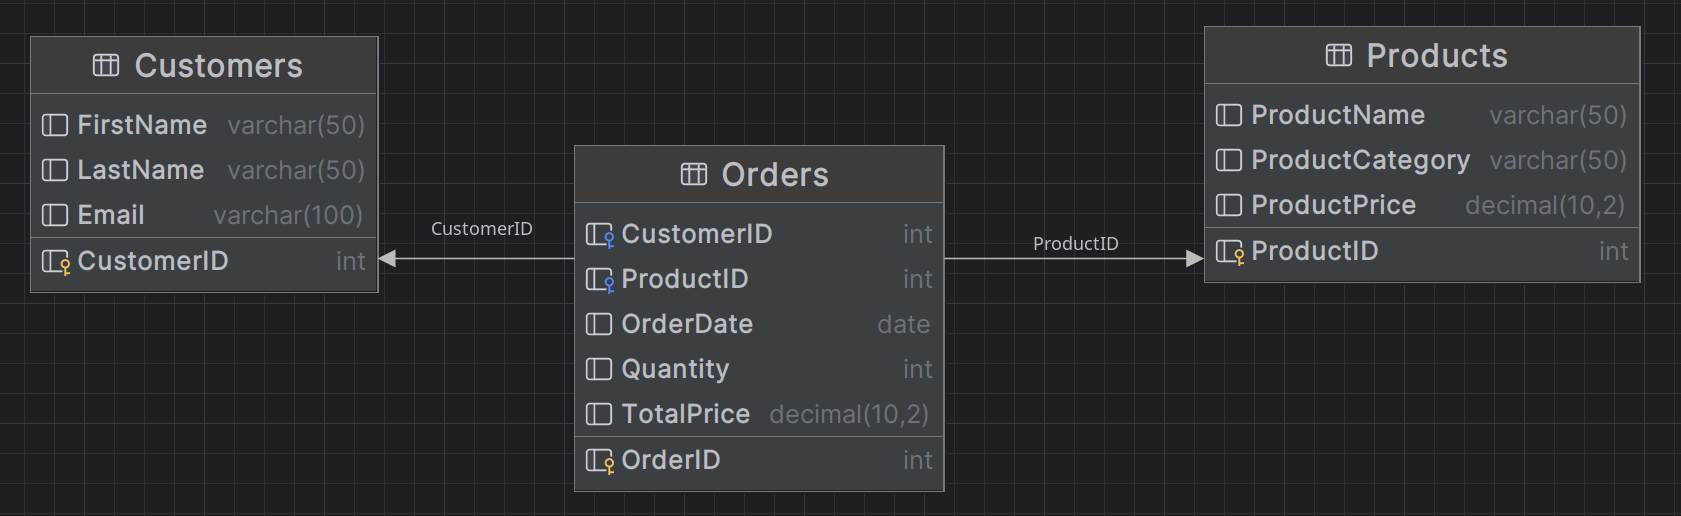
Normalization means storing data in multiple tables and maintaining relationships using foreign keys. This approach ensures data consistency and accuracy, making updates and deletions straightforward. Let’s see the image below to understand better. The data is divided into multiple tables that relate together.
Entity Relationship Diagram (ERD)
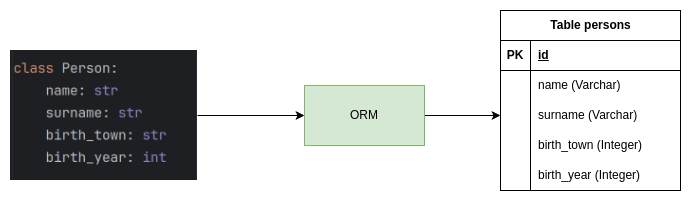
ERDs helps to ensure that the data is consistent and accurate and that updates and deletions are performed correctly. We could say that these CRUD operations are the main focus of transactional data modeling. Hence, we in backend use ORM tools like Hibernate, JPA, or Entity Framework to interact with the database and perform these operations. Because ORM is simple mapping between data held in objects in programming languages and SQL tables, it is easy to use and understand. The ORM tools optimisation is focused on fast writing, with small tables that makes it easy to insert, update, and delete data.
Performance
While transactional databases excel in write operations, read performance can be a bottleneck. Hence, the most APIs are relying on caching the data or various horizontal/vertical scaling of servers to improve the performance. The data layer is storing data in pure form, such as events, logs, and transactions. This data handling method is known as OLTP (Online Transaction Processing).
Analytical Data Modeling
Analytical data modeling is the process of designing a database schema to support analysis, decision-making, and business intelligence. This approach is optimised to handle reads of large volumes of data and complex queries and aggregations efficiently. Such data is usually stored in a data warehouse, which is a separate database from the transactional one. Data Warehouse is optimized for read-heavy workloads and is ideal for situations where data needs to be analyzed, queried or visualized in various ways to extract insights.
Denormalization
When we are thinking about denormalization we are thinking about fact tables and dimension tables. Fact tables contain the metrics or measures that we want to analyze, and dimension tables contain the attributes or dimensions by which we want to analyze the data. Analytical models use denormalization to store data in fewer tables, with less emphasis on maintaining relationships. The focus is on aggregations and trends rather than individual transactions.
Star Schema
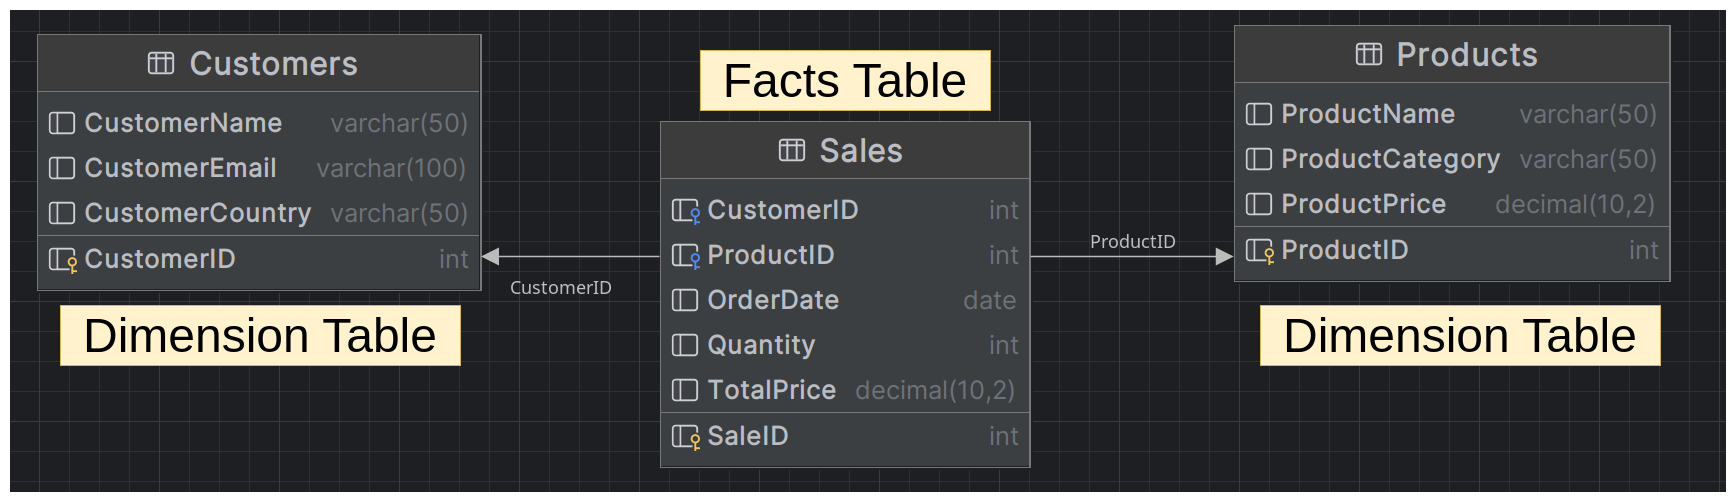
There are some common design patterns using dimensional modeling, which uses star schema, snowflake schema or kind of mixes of facts and dimensions. It really depends on the use case and the data we are working with. In a star schema, there is a central fact table that contains the metrics or measures that we want to analyze, surrounded by multiple dimension tables that contain the attributes or dimensions by which we want to analyze the data.
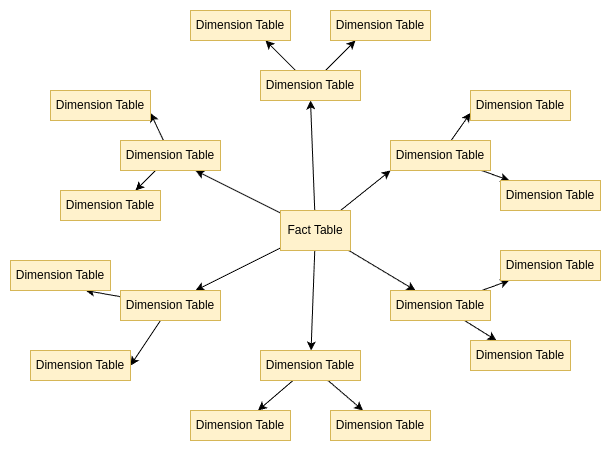
Snowflake Schema
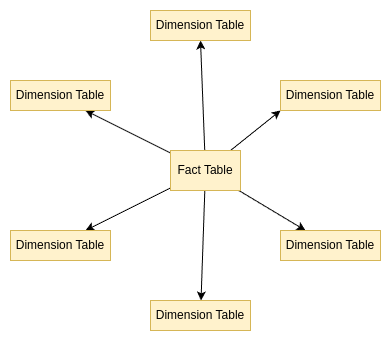
Then a snowflake schema, where the diagram of schema resembles s Snowflake with branches radiating from the center. Is a compromise between normalized and denormalized data, the dimension tables are normalized, meaning that they are split into multiple tables. This is ideal for systems that require a good balance between query performance and storage efficiency.
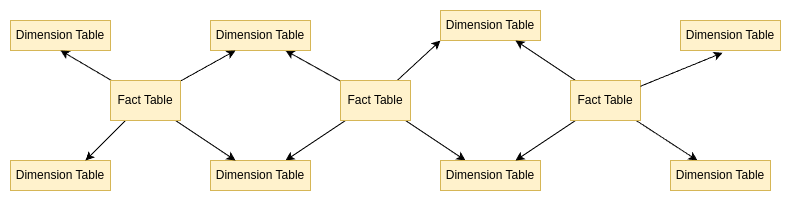
Galaxy Schema
But in my experience you will end up with many fact tables that will be glued together with dimensions. And so we just created a galaxy schema - Fact Constellation Schema. This is useful when we have multiple business processes that we want to analyze separately.
Slowly Changing Dimensions (SCD)
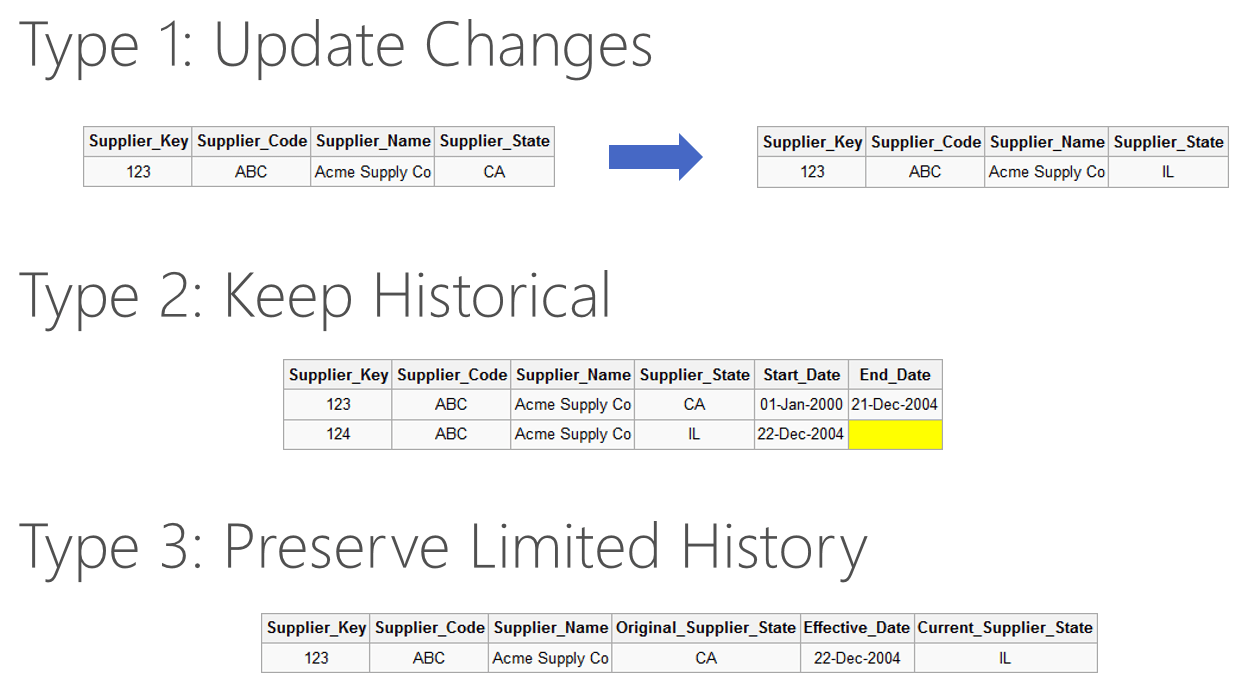
When we are remodelling data, we are often in need of replacing the natural primary keys with surrogate keys. This is because natural keys are not always unique and can change over time, which can lead to data inconsistencies. Also, as the data are changing, we often need to keep track of the changes, with all of their versions. For that we are using so called Slowly Changing Dimensions that are used to track changes in dimension tables over time. Techniques like Type 1 (overwrite old data), Type 2 (create new records while keeping old data), and Type 3 (add new column) are used to manage these changes. Extremely fascinating topic, right? Actually I want to write one day about all 7 types.
Data Modeling Process
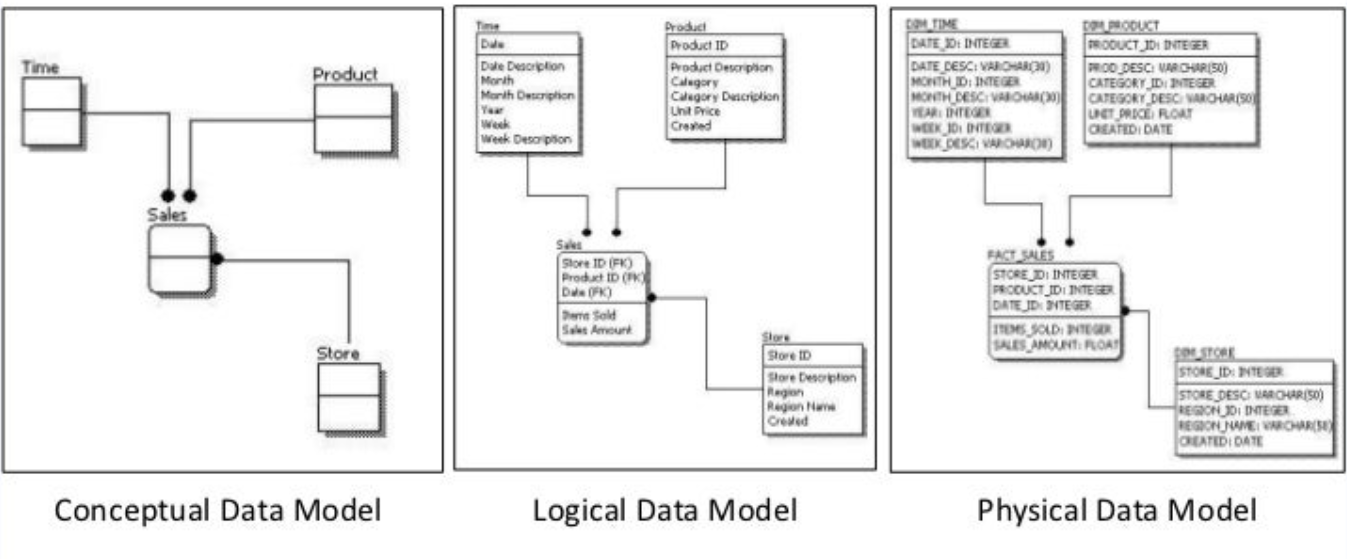
The entire data modeling starts with understanding the business requirements and the data sources, from these we understand
what we want to analyse and create a Conceptual Model Design. This usually looks like boxes and lines, where boxes
are entities like Sales, Product, Store and lines are relationships between them. Then we create a Logical Model
Design, which is same as before, but with added properties into these boxes. For example into Sales Fact table, we
can now add fields like Items Sold, Sales Amount because that is what business are interested in analysing, plus we
add Foreign Key Ids for all dimensions related to this table. And finalise data modeling, we create a Physical Model
Design where we are designing actual tables and columns in the database.
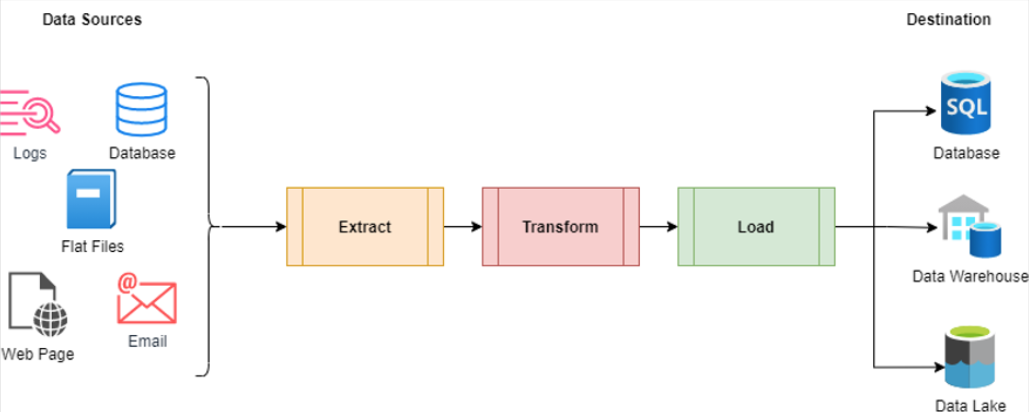
Data Pipeline
Surely, we want our API database respond in mili or microseconds, but when analyzing data, the end user is not customer but Data Analyst or other internal persona, so we can wait minutes or hours for our data to be ready for us. Therefore, the fact tables have aggregated data and pre-calculated values, which makes it easier to query and analyze the data. To keep performance in order, we partition the data into smaller chunks, which makes it easier to manage and query large volumes of data. We also index the data to improve query performance. Such data are usually prepared by the data pipelines and ETL (Extract, Transform, Load) processes that are responsible for moving data from the source systems to the data warehouse, transforming the data into the desired format, and loading it into the data warehouse.
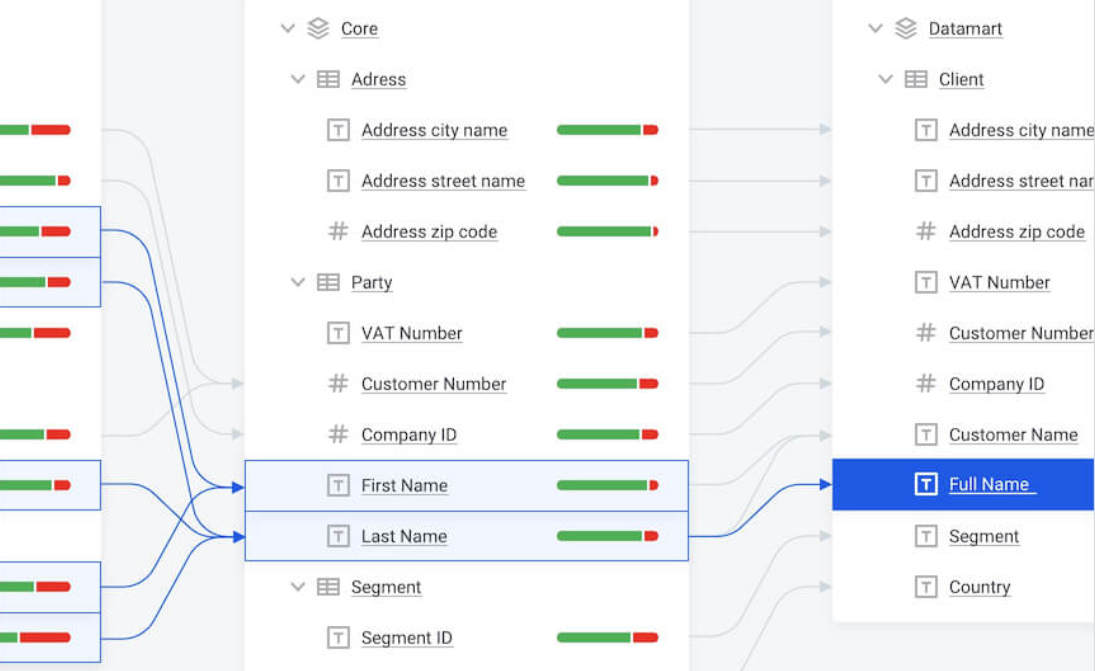
Data Catalogue
As you can see, one pipeline is never enough, and you just created your n-tieth pipeline and because you are losing track of what is happening. That’s why we are also using Data Catalogues. Catalogs are here to keep track of all the data sources, data pipelines, and data transformations. Basically to document the data lineage, data quality, and data governance, and to ensure that the data is accurate and reliable.
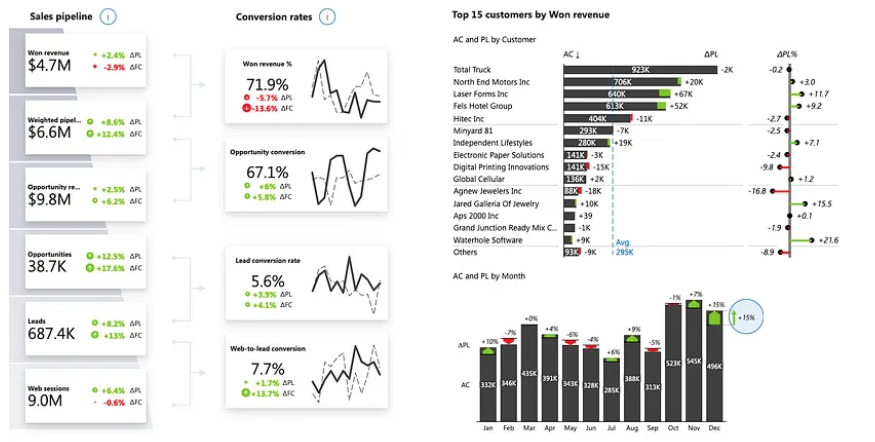
Business Intelligence
Great, so we have much data here now, that we should analyze and visualize, right? That’s why we are using BI tools that are used to create dashboards and reports for business users, various visual representations of data or predictive models. These are crucial for strategic decision-making and business planning.
And the rest
I know, I know. I didn’t mention data security, data privacy, data governance, data quality, data migrations, data evolution and many other topics that are crucial to take into consideration for data modeling. But my point here was just to give you a simple 1000 feet above the data modeling view of the differences and why you might need a data engineer to take care of your data instead of just a backend engineer.
What is not Data Modeling
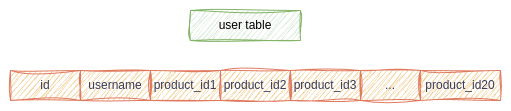
Single table design
I have seen this once, where an engineer was pushing for a single table for all the data. He was saying something along the lines that it is easier to query and that we don’t need to worry about joins, this is properly denormalized data. Don’t do this!
Conclusion
Throughout my career, I’ve seen various approaches to data modeling, some leading to significant issues due to misunderstandings and poor maintenance. I intentionally didn’t go deeper into some details, but for a deeper dive into these topics, I recommend “The Data Warehouse Toolkit” by Ralph Kimball and Margy Ross. Probably the most comprehensive guide to dimensional modeling and data warehousing, considered the bible of data warehousing.
link to amazon: The Data Warehouse Toolkit
Summary of Differences
| Transactional | Analytical | |
|---|---|---|
| Purpose | daily operations and transactions in business | analysis, decision-making, business intelligence |
| Structure | normalized to reduce redundancy and improve data integrity | denormalized - allows complex queries and aggregations |
| Design | ERD, UML, normalization | dimensional modeling, star schema, snowflake schema |
| Tools | SQL, ORM | SQL, OLAP, BI tools |
| Performance | high write, low read | low write, high read |
| Query | simple queries, CRUD operations | complex queries, aggregations, joins |
| Processing | OLTP (Online Transaction Processing) | OLAP (Online Analytical Processing) |
| Examples | sales/order processing, inventory management, customer service(CRM) | data warehousing, data mining, predictive models |
As you can see, data modeling is vital for performance and usability. The best solution depends on your specific use case. Let me know if you found anything interesting and worth exploring further. I’m sure I will write more about various data engineering topics in the future.